Helping Enterprises Understand and Reduce Their Cloud Costs
Cloud costs are now the second biggest expense for tech companies after salaries. In 2024, businesses wasted over $60 billion on the cloud. And with the rise of AI, that number is only going to get worse.

Role
Role
Product Designer
Company
Company
OpsLyft
Industry
Industry
B2B Enterprise Tech
Customer
Customer
Innovaccer
Annual Cloud Spend
Annual Cloud Spend
~ $20M
Challenge
Cloud cost management tools aren't designed for how teams work. Existing solutions overwhelmed users with dashboards that lacked team-wide context, and left engineers out of the loop. Each enterprise's cloud waste is unique, but no platform captures that collective knowledge.
As a result, enterprises are:
Wasting cloud costs without knowing the why.
Manually creating spreadsheets to track budgets.
Struggling to correlate cloud costs to business value.
How We Got Started
We started by diving into the pain points of real users. The kickoff involved:
Listening to Sales & Customer Success calls with 5+ enterprise accounts.
Reviewing support tickets from customers struggling with cloud billing data.
Running a focused workshop with the PM and engineers to map out current user flows and identify bottlenecks.
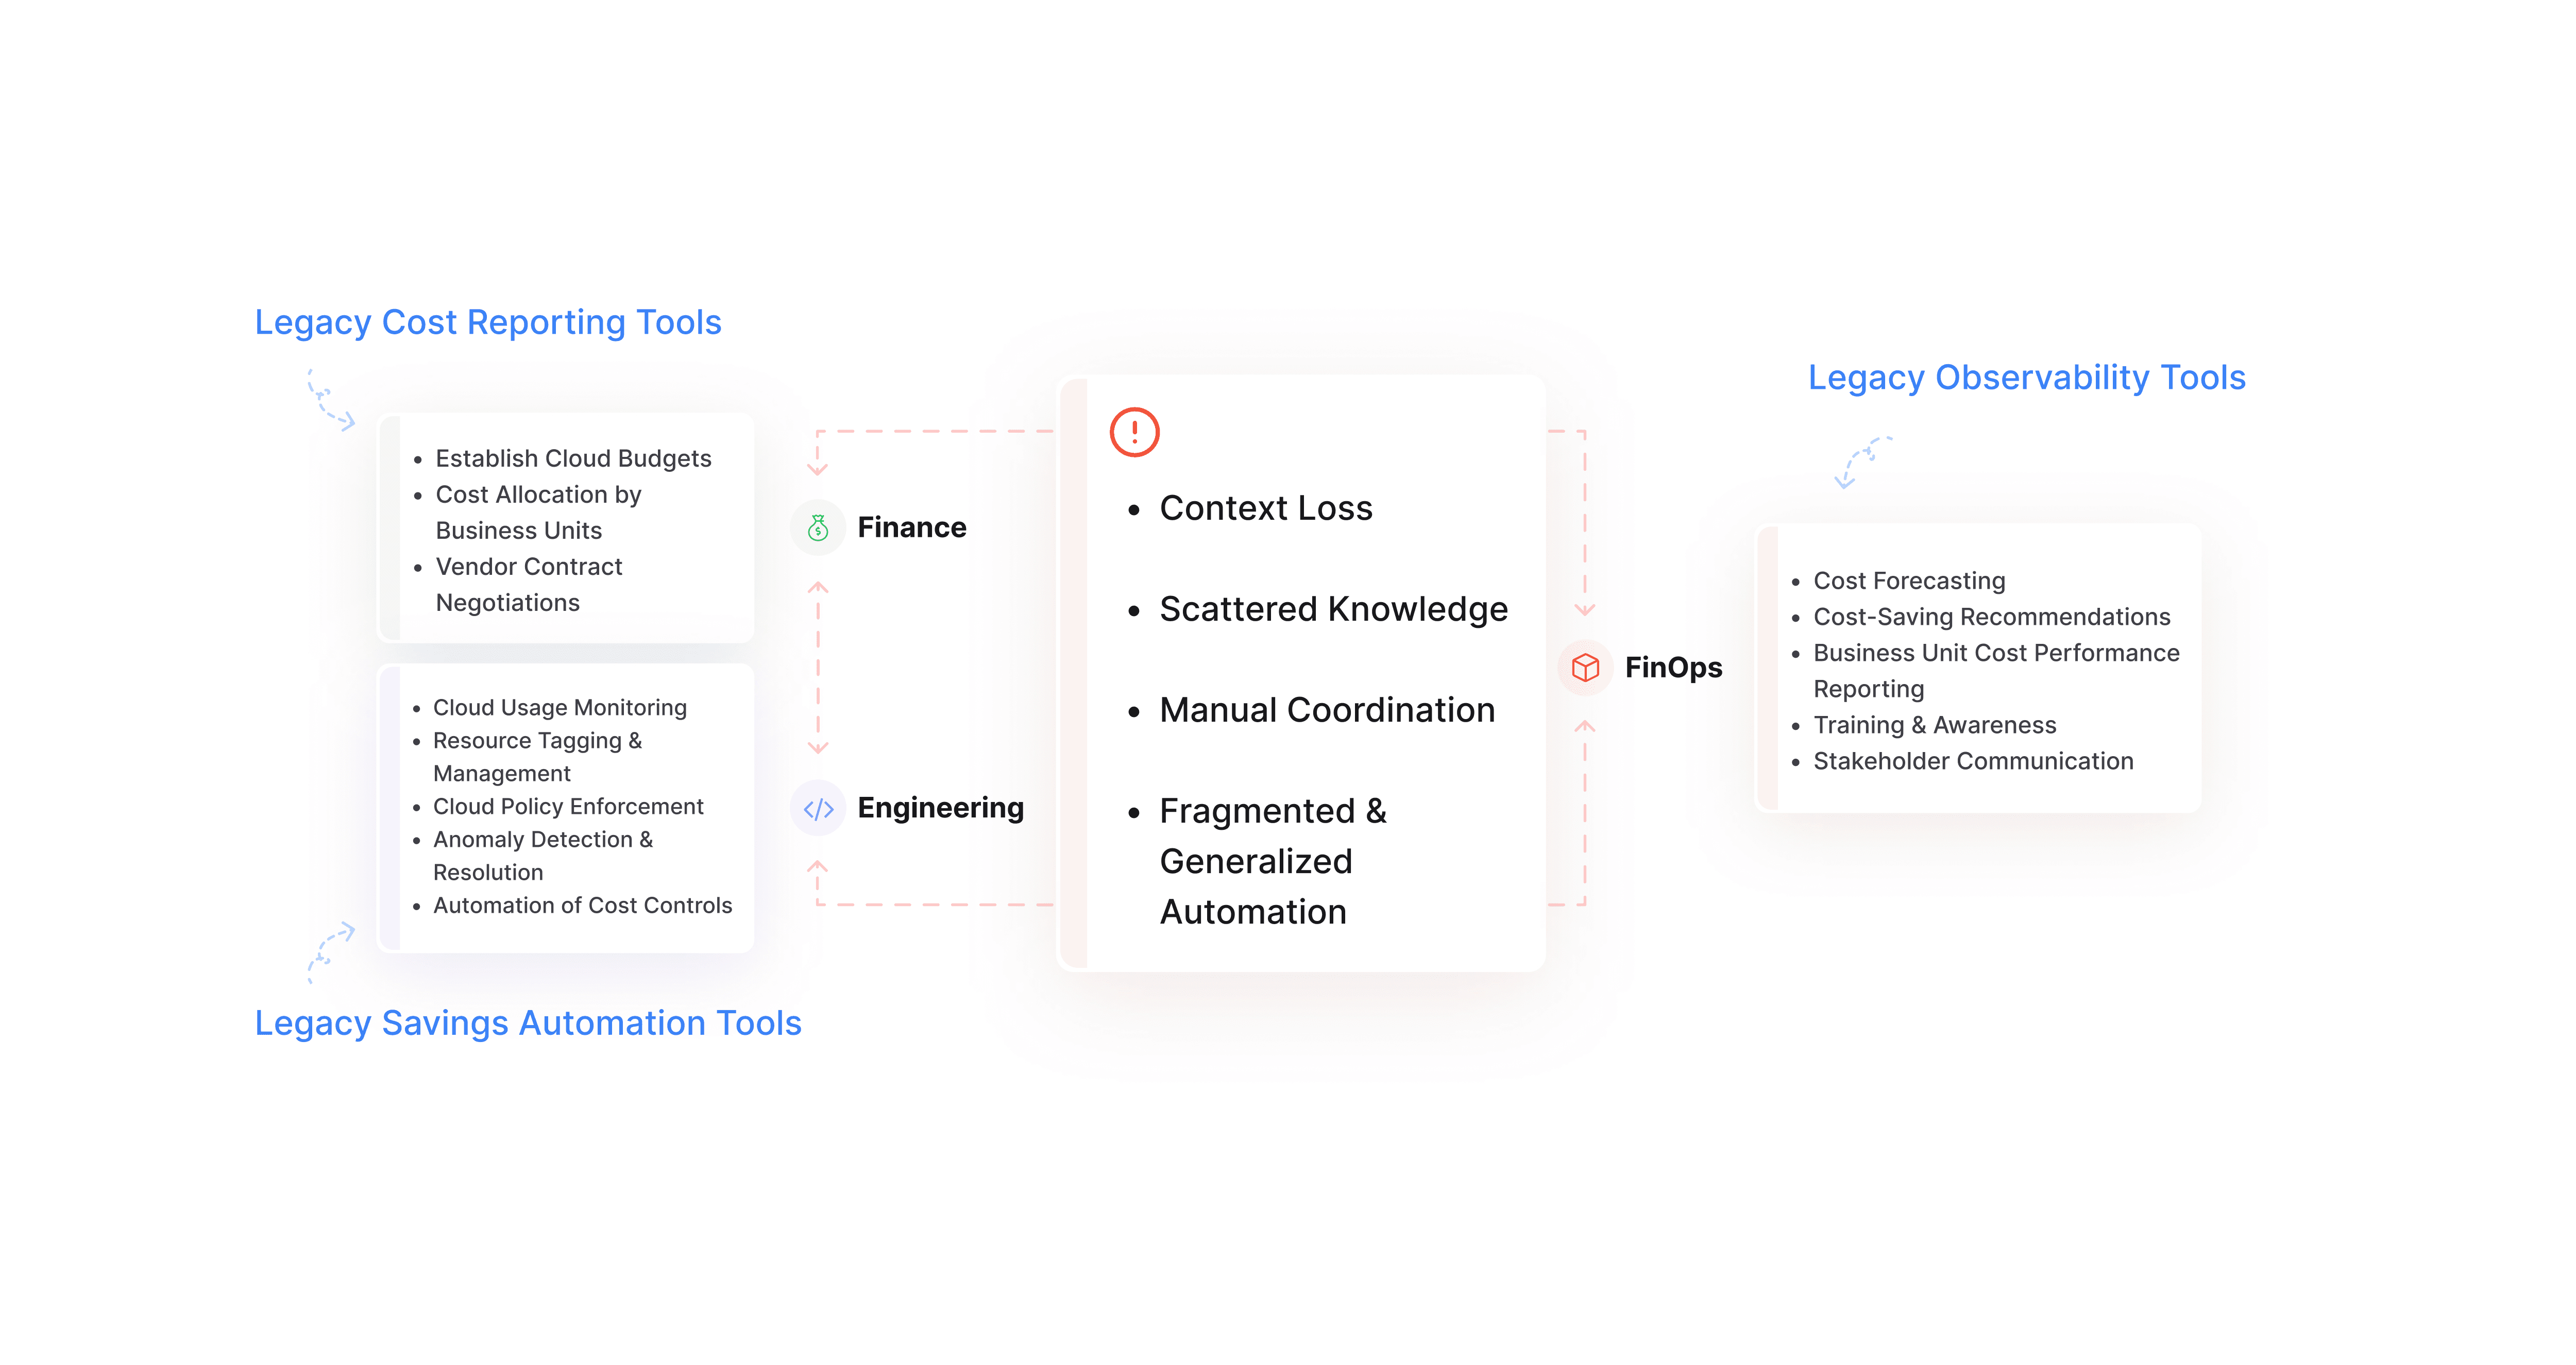
We realized different teams had different questions about cloud spending:
Finance teams wanted to know how cloud costs affect profit.
Engineers wanted to know what they owned and how to fix issues.
FinOps teams were stuck in spreadsheets, trying to make sense of it all.
Together, we reframed the core product question:
“How might we create a shared source of truth for cloud cost accountability across roles?”
We started by diving into the pain points of real users. The kickoff involved:
Listening to Sales & Customer Success calls with 5+ enterprise accounts.
Reviewing support tickets from customers struggling with cloud billing data.
Running a focused workshop with the PM and engineers to map out current user flows and identify bottlenecks.
We realized different teams had different questions about cloud spending:
Finance teams wanted to know how cloud costs affect profit.
Engineers wanted to know what they owned and how to fix issues.
FinOps teams were stuck in spreadsheets, trying to make sense of it all.
Together, we reframed the core product question:
“How might we create a shared source of truth for cloud cost accountability across roles?”
Research & Assumptions
We made a few early assumptions:
FinOps professionals needed detailed dashboards.
Engineers wouldn’t engage with cost data.
Finance wanted top-line summaries only.
How we validated (or debunked) them:
We conducted 8+ user interviews across FinOps, Engineering, and Finance teams at mid to late-stage SaaS companies.
We shadowed an enterprise FinOps team, creating spreadsheets manually every week.
We ran two usability tests on an early concept prototype to observe cross-team interactions.
Key Insight: Every team wanted different levels of context—but from a single, shared source of truth. Engineers wanted actionable, Finance wanted summaries, and FinOps wanted both. No one wanted another "dashboard."
Competitive Research & Gap Analysis
Next, I studied major FinOps tools in the market - like CloudZero, Finout, Cloudability, Vantage, and native dashboards from AWS/GCP/Azure. While they offered decent reporting, I identified critical gaps:
Lack of role-based views (most tools took a one-size-fits-all approach).
Poor actionability: Insights didn’t translate into the next steps.
Limited integration with daily workflows (e.g., JIRA, Slack).
User Flows & Wireframes
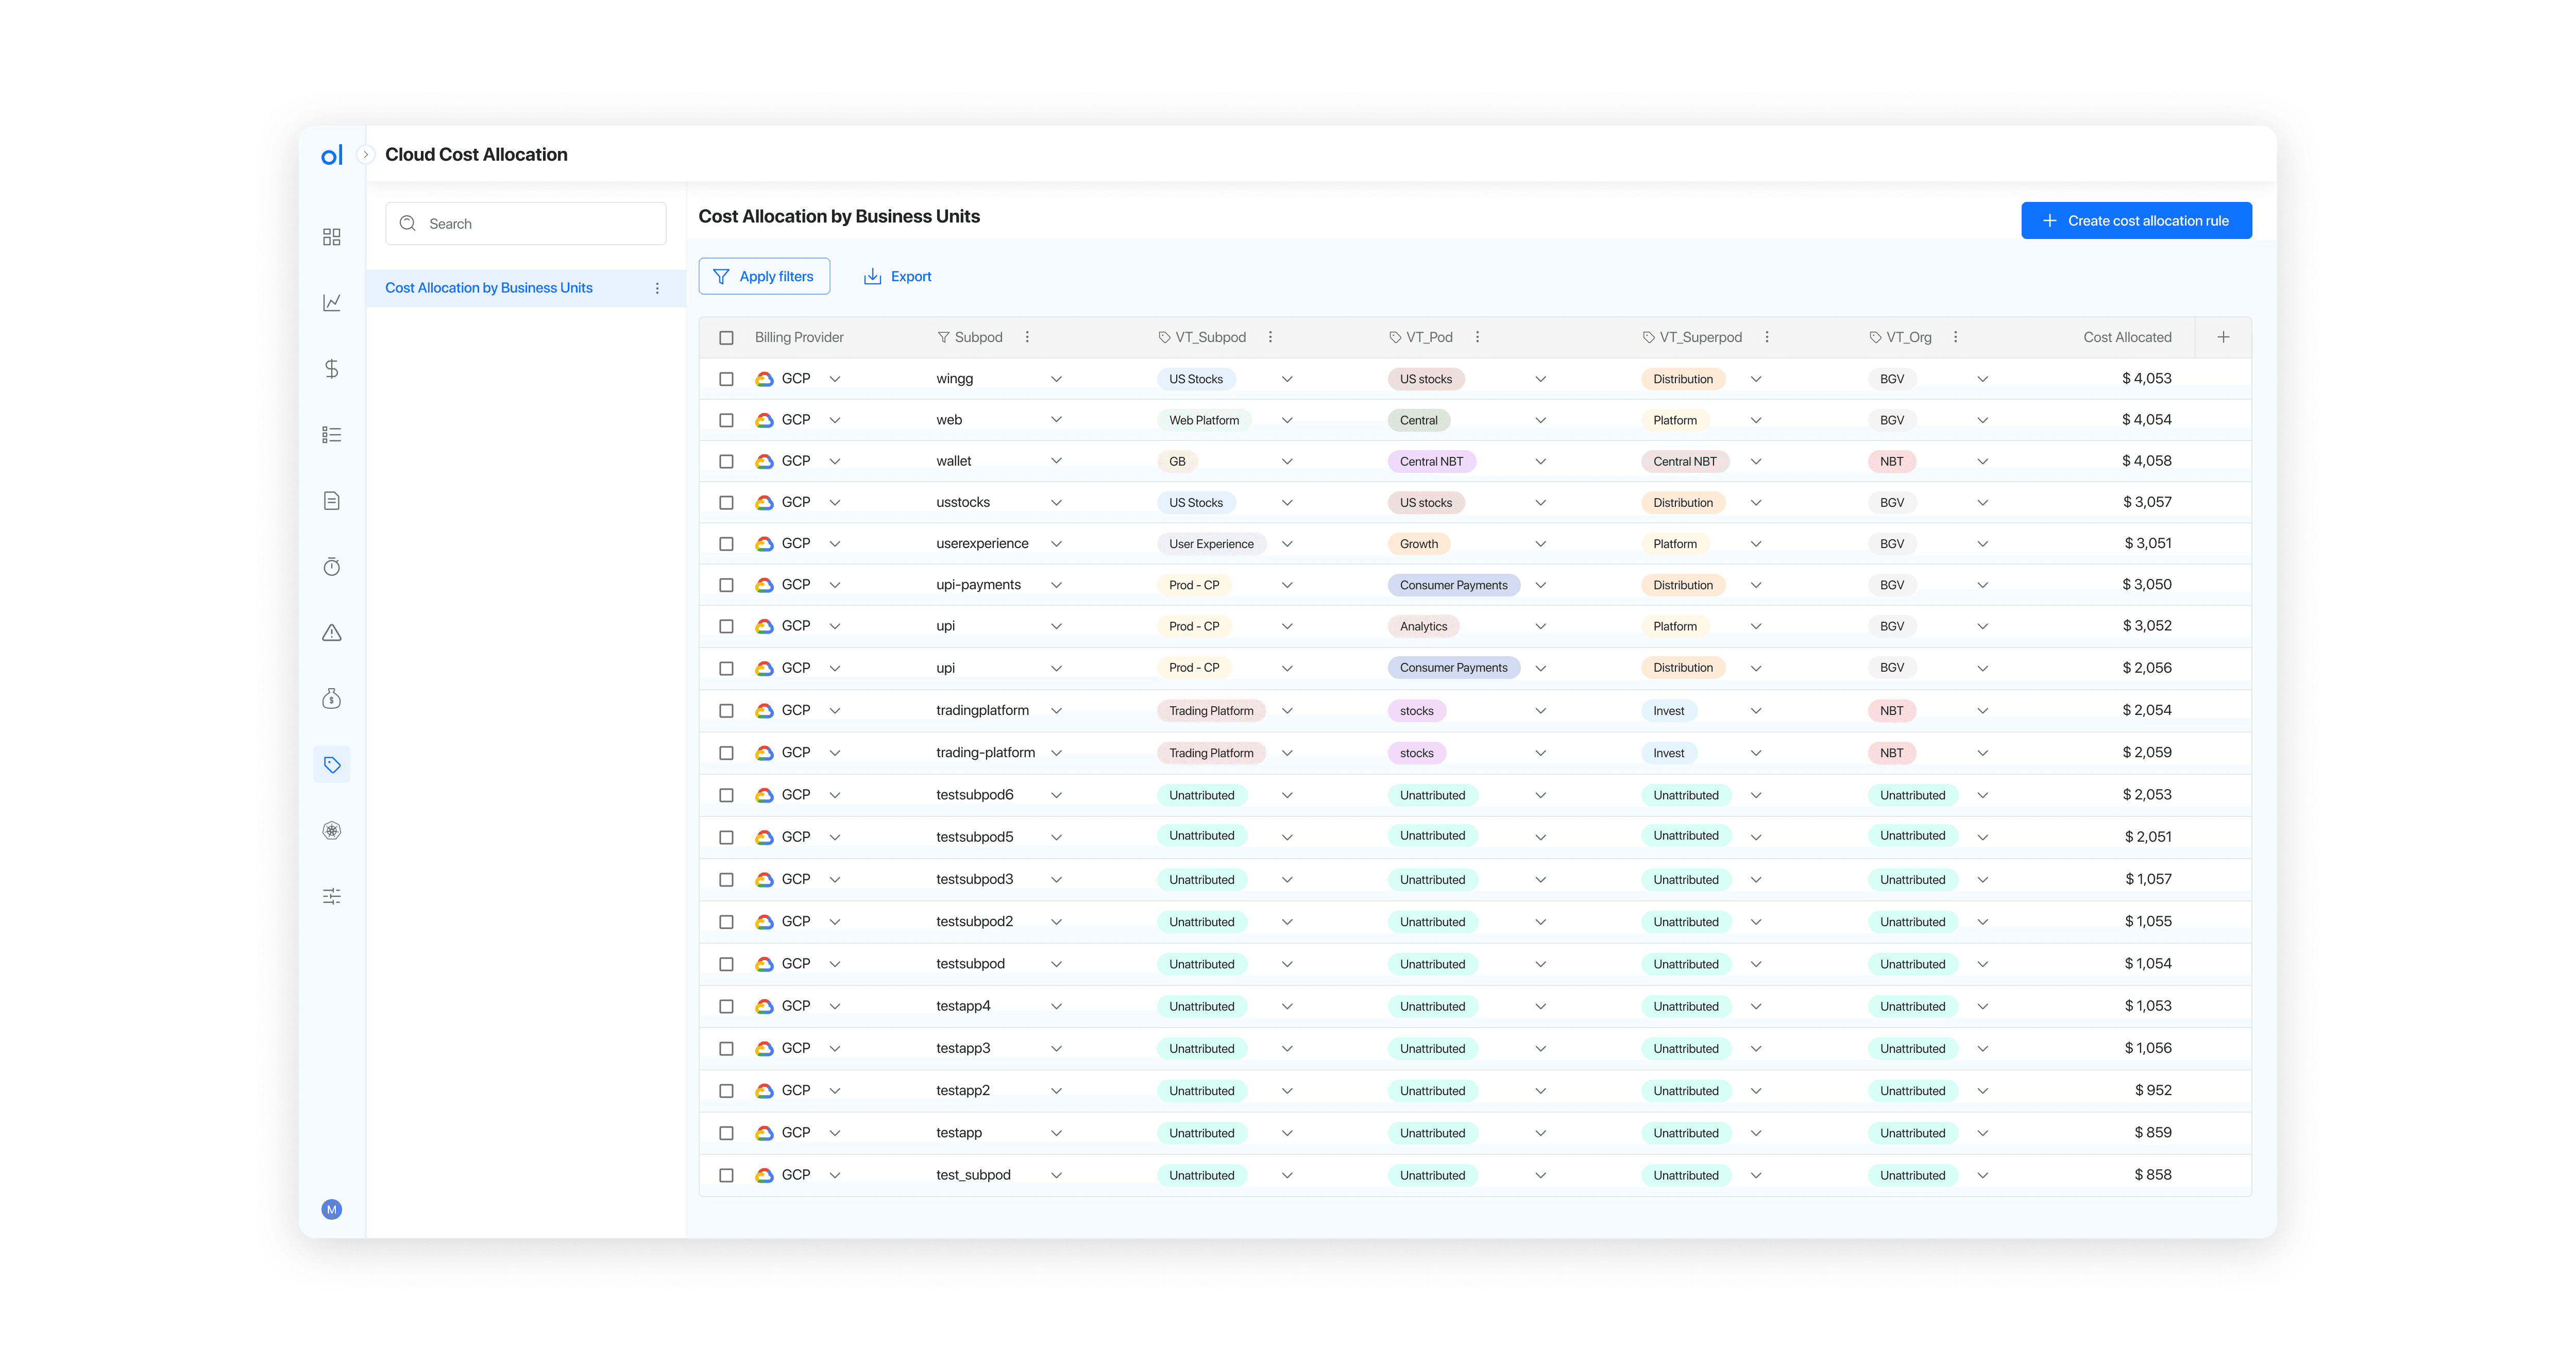
I mapped out user flows, and based on that, I laid out wireframes that focused on:
A single source of truth for all cloud spending.
Budget allocation per team or customer.
Clear cost-to-impact visibility (e.g., Cost/MRR, cost per customer).
I mapped out user flows, and based on that, I laid out wireframes that focused on:
A single source of truth for all cloud spending.
Budget allocation per team or customer.
Clear cost-to-impact visibility (e.g., Cost/MRR, cost per customer).
We made a few early assumptions:
FinOps professionals needed detailed dashboards.
Engineers wouldn’t engage with cost data.
Finance wanted top-line summaries only.
How we validated (or debunked) them:
We conducted 8+ user interviews across FinOps, Engineering, and Finance teams at mid to late-stage SaaS companies.
We shadowed an enterprise FinOps team, creating spreadsheets manually every week.
We ran two usability tests on an early concept prototype to observe cross-team interactions.
Key Insight: Every team wanted different levels of context, but from a single, shared source of truth. Engineers wanted actionable, Finance wanted summaries, and FinOps wanted both. No one wanted another "dashboard."


I mapped out user flows, and based on that, I laid out wireframes that focused on:
A single source of truth for all cloud spending.
Budget allocation per team or customer.
Clear cost-to-impact visibility (e.g., Cost/MRR, cost per customer).
How It Worked in the Real World
We rolled this out with Innovaccer, a fast-growing healthcare tech company:
They had over 100 AWS and Azure accounts and were spending ~ $20M annually on the cloud.
Teams were working in silos and had no shared view of costs.
We rolled this out with Innovaccer, a fast-growing healthcare tech company:
They had over 100 AWS and Azure accounts and were spending ~ $20M annually on the cloud.
Teams were working in silos and had no shared view of costs.
We rolled this out with Innovaccer, a fast-growing healthcare tech company:
They had over 100 AWS and Azure accounts and were spending ~ $20M annually on the cloud.
Teams were working in silos and had no shared view of costs.


Results
Post-design & handoff, the following outcomes were achieved:
We saved 8 hours/month for 70 stakeholders to find and analyze any cloud cost information.
Time to act on insights dropped from 7 days to just 1 day.
Within one week of launch, every dollar spent on the cloud was mapped to a budget owner.
Post-design & handoff, the following outcomes were achieved:
We saved 8 hours/month for 70 stakeholders to find and analyze any cloud cost information.
Time to act on insights dropped from 7 days to just 1 day.
Within one week of launch, every dollar spent on the cloud was mapped to a budget owner.
Final Thoughts
This taught me that great UX isn’t just about simplicity—it’s about shared clarity. When every team sees cost data in their language, they can finally work together to drive savings and accountability.
I’m proud of how we brought alignment between Finance, Engineering, and FinOps—three teams that rarely speak the same language—through thoughtful, role-specific design.
“OpsLyft is an invaluable tool for managing cloud costs, providing cross-cloud cost aggregation and customizable dashboards for real-time insights. Its focus on actionable insights empowers us to reduce our cloud expenses.”

Bill Burton
Bill Burton
Bill Burton
VP of Cloud Engineering, Innovaccer
Results
Post-design & handoff, the following outcomes were achieved:
We saved 8 hours/month for 70 stakeholders to find and analyze any cloud cost information.
Time to act on insights dropped from 7 days to just 1 day.
Within one week of launch, every dollar spent on the cloud was mapped to a budget owner.